
Having data at your fingertips is what helps you keep up with the social media updates and the last changes that take place behind the scene.
And when I say “behind the scene”, I mean analytics data that unveils industry changes influenced by fluctuations in metrics’ values for every social media network.
Luckily, the team from Socialinsider has recently launched an updated version of their social media industry benchmarks study, highlighting how engagement on social media is declining year after year.
Let’s find out together what happened on every social media network that influenced changes for top industries.
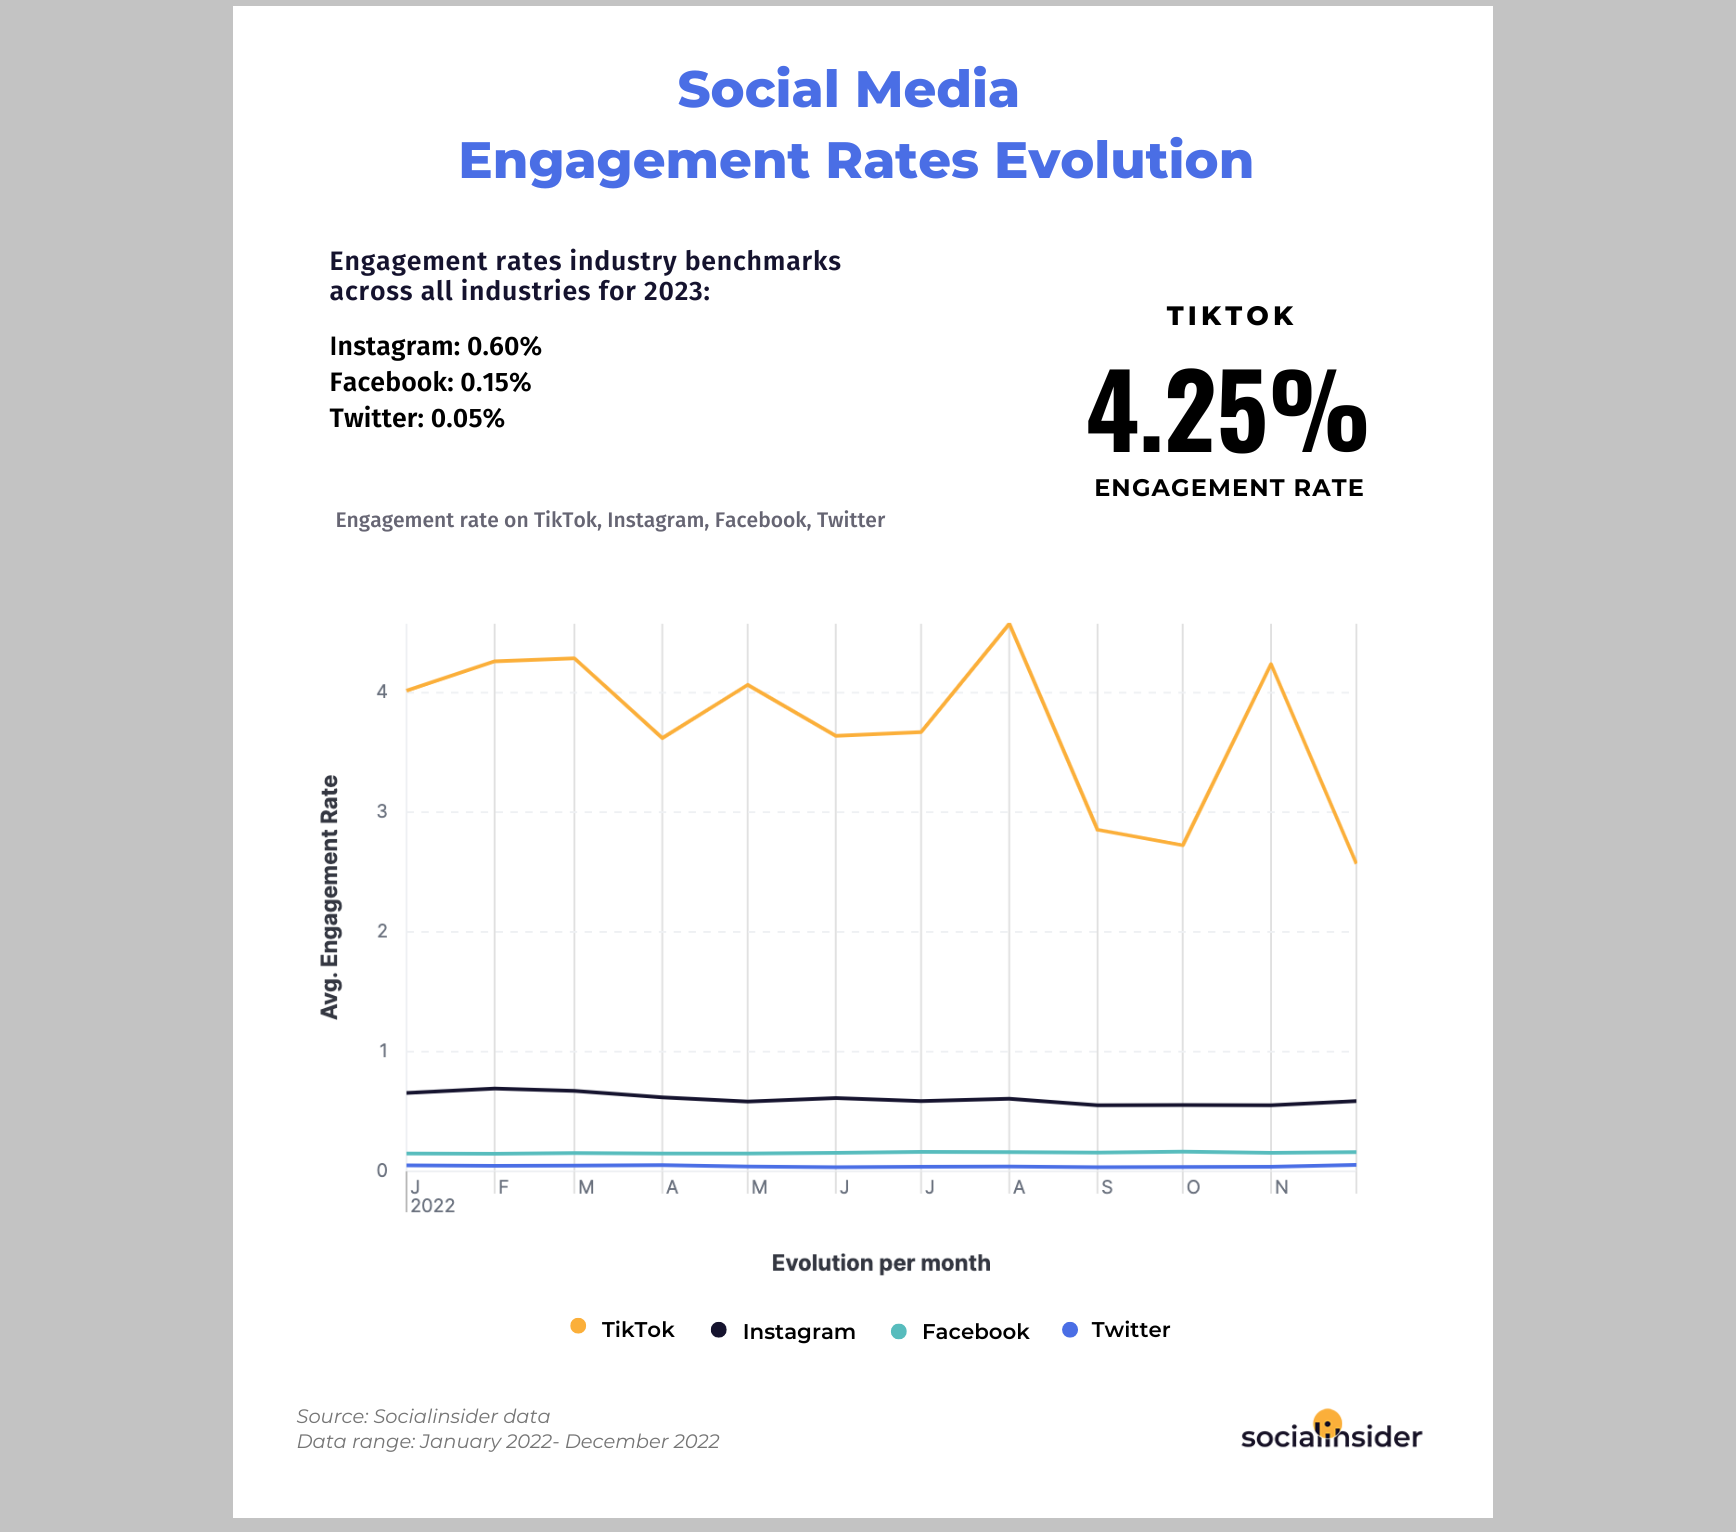
On TikTok, the engagement rate calculated by followers is 4.25% on average, and the engagement rate calculated by views is 5.10%.
This shows that the engagement rate for TikTok, on average, has dropped by 28%.
For Instagram, the story is no different. For this social platform, the engagement rate is 0.60%, showing that it’s on a downward slope.
On Instagram, Reels is the best-performing type of content.
When it comes to Facebook, the engagement rate is situated at an average of 0.15%, while the engagement rate for Twitter ranks last, with 0.05% on average.
When making a comparison with the other three well-known social media networks, the highest engagement rate is on TikTok, with a value of 4.25%.
This is what gives hope to marketers, thinking that videos are the key to an increasing engagement rate.
To make proper use of the data obtained via social media benchmarks, you need specific insights for your industry. This way, you can use the data to build a marketing strategy with higher chances of success.
By comparing the performance of top 20 industries depending on engagement rate in 2021 and 2022, Socialinsider obtained promising results for the development of accurate strategies.

The popularity of TikTok is easily influencing the manner in which audiences react to different content types on other social media networks.
Therefore, brands learnt to adapt, making room for change and updated marketing strategies.
The Beverages industry is the most engaging sector on TikTok, with an engagement rate of 7.69%.

When thinking about Instagram, where Reels have transformed into TikTok videos’ greatest competition, there are some industries that managed to make a difference.
This year’s social media industry benchmarks showed that the most engaging sector on Instagram is the FMCG Food industry.
The FMCG Food sector has an engagement rate that reached 0.96%.
In comparison with the platform’s overall low engagement rate, numerous brands from the Airlines industry, FMCG Food, Arts & crafts, Beverages, Travel and Alcohol can be proud of their results.
Industry benchmarks show that all these sectors have above-average engagement scores.

When looking at Facebook, despite the overall dropping engagement rate, there are some sectors that feature a higher performance, standing out.
The Beverages and FMCG Food sectors differentiate themselves from the rest of the sectors, when it comes to the engagement rate registered on Facebook.
When considering Twitter, its engagement rate has remained steady for quite a while now.
However, regarding the engagement rate, the sector that reached a new high on Twitter is the Arts & crafts industry.
This sector has a double engagement rate in comparison with the overall score for other social media networks.
TikTok proved it already: videos rock on social. It set the bar high for other social media networks and now users prefer videos instead of using other forms of content.
The reason is pretty obvious. Videos are more entertaining, shorter and it takes less time to watch them.
The social network that quickly followed lead is Instagram, with the increasing popularity of Reels.
Data shows that Instagram Reels register an engagement rate of 0.93% on average, almost double if we compare it to the values registered for other kinds of posts.
There’s a reason why Reels manage to register such highs.
It is all thanks to the Reels’ double exposure, nurtured by the platform’s algorithm. Reels appear both in the regular Instagram feed (where there also appear carousels and images), and the Reels video feed.

Older social networks have also started riding this new wave of videos. Facebook now has its own Reels feature.
This shows that Facebook’s videos are the most engaging form of content, recording an engagement rate of 0.17%.
Relaying on our research, Twitter has the overall lowest engagement rate. However, an in-depth analysis of all average engagement rates for every content type on Twitter has revealed that videos can record the same values as they do on Facebook.
Here are a few practices from experts inspired by the infos that you find in the social media industry benchmarks study 2023:
All the information obtained can help you change your social media content planning based on the latest trends and audience’s interests.
Read next: What Tools Does A Small Business Need For A Successful Empire? This Study Has The Answer
And when I say “behind the scene”, I mean analytics data that unveils industry changes influenced by fluctuations in metrics’ values for every social media network.
Luckily, the team from Socialinsider has recently launched an updated version of their social media industry benchmarks study, highlighting how engagement on social media is declining year after year.
Let’s find out together what happened on every social media network that influenced changes for top industries.
1.Key insights on social media engagement benchmarks
Socialinsider found that the engagement rate for all social media networks has gradually decreased.On TikTok, the engagement rate calculated by followers is 4.25% on average, and the engagement rate calculated by views is 5.10%.
This shows that the engagement rate for TikTok, on average, has dropped by 28%.
For Instagram, the story is no different. For this social platform, the engagement rate is 0.60%, showing that it’s on a downward slope.
On Instagram, Reels is the best-performing type of content.
When it comes to Facebook, the engagement rate is situated at an average of 0.15%, while the engagement rate for Twitter ranks last, with 0.05% on average.
When making a comparison with the other three well-known social media networks, the highest engagement rate is on TikTok, with a value of 4.25%.
This is what gives hope to marketers, thinking that videos are the key to an increasing engagement rate.
2.Social media benchmarks for every platform
Brands that establish an online presence on every social media network can easily make a distinction between the audiences from each of them and how they respond differently to each content type.To make proper use of the data obtained via social media benchmarks, you need specific insights for your industry. This way, you can use the data to build a marketing strategy with higher chances of success.
By comparing the performance of top 20 industries depending on engagement rate in 2021 and 2022, Socialinsider obtained promising results for the development of accurate strategies.
The popularity of TikTok is easily influencing the manner in which audiences react to different content types on other social media networks.
Therefore, brands learnt to adapt, making room for change and updated marketing strategies.
The Beverages industry is the most engaging sector on TikTok, with an engagement rate of 7.69%.

When thinking about Instagram, where Reels have transformed into TikTok videos’ greatest competition, there are some industries that managed to make a difference.
This year’s social media industry benchmarks showed that the most engaging sector on Instagram is the FMCG Food industry.
The FMCG Food sector has an engagement rate that reached 0.96%.
In comparison with the platform’s overall low engagement rate, numerous brands from the Airlines industry, FMCG Food, Arts & crafts, Beverages, Travel and Alcohol can be proud of their results.
Industry benchmarks show that all these sectors have above-average engagement scores.
When looking at Facebook, despite the overall dropping engagement rate, there are some sectors that feature a higher performance, standing out.
The Beverages and FMCG Food sectors differentiate themselves from the rest of the sectors, when it comes to the engagement rate registered on Facebook.
When considering Twitter, its engagement rate has remained steady for quite a while now.
However, regarding the engagement rate, the sector that reached a new high on Twitter is the Arts & crafts industry.
This sector has a double engagement rate in comparison with the overall score for other social media networks.
TikTok proved it already: videos rock on social. It set the bar high for other social media networks and now users prefer videos instead of using other forms of content.
The reason is pretty obvious. Videos are more entertaining, shorter and it takes less time to watch them.
The social network that quickly followed lead is Instagram, with the increasing popularity of Reels.
Data shows that Instagram Reels register an engagement rate of 0.93% on average, almost double if we compare it to the values registered for other kinds of posts.
There’s a reason why Reels manage to register such highs.
It is all thanks to the Reels’ double exposure, nurtured by the platform’s algorithm. Reels appear both in the regular Instagram feed (where there also appear carousels and images), and the Reels video feed.
Older social networks have also started riding this new wave of videos. Facebook now has its own Reels feature.
This shows that Facebook’s videos are the most engaging form of content, recording an engagement rate of 0.17%.
Relaying on our research, Twitter has the overall lowest engagement rate. However, an in-depth analysis of all average engagement rates for every content type on Twitter has revealed that videos can record the same values as they do on Facebook.
3. Best practices from experts inspired by social media industry benchmarks 2023
After getting all this data about all social media networks, brands can adjust or create new marketing strategies that fuel their growth and brand recognition.Here are a few practices from experts inspired by the infos that you find in the social media industry benchmarks study 2023:
- Don’t repurpose videos from other social networks and utilize them on TikTok;
- Post relevant news related to trending content;
- Introduce the use of carousels to increase reach;
- Be careful when it comes to your audience’s interests;
- Post a Story every day for audience retention;
- Implement short-form videos, with a twist, sprinkled with a personal approach;
- Invest more time and resources to develop a loyal community;
- Try Twitter Spaces to connect with your audience.
Final thoughts
The study is meant to help marketers and brands who need a solid strategy based on numbers.All the information obtained can help you change your social media content planning based on the latest trends and audience’s interests.
Read next: What Tools Does A Small Business Need For A Successful Empire? This Study Has The Answer